Power BI
Power BI aims to provide interactive visualizations and business intelligence capabilities with an interface simple enough for end users to create their own reports and dashboards.
Find out more
The parts of Power BI
Power BI consists of a Microsoft desktop application called Power BI Desktop, an online SaaS (Software as a Service) service called the Power BI service, and mobile Power BI apps that are available on windows phones and tablets, and also on Apple iOS and Google Android devices.
More Examples of what we Offer
Summary of sales
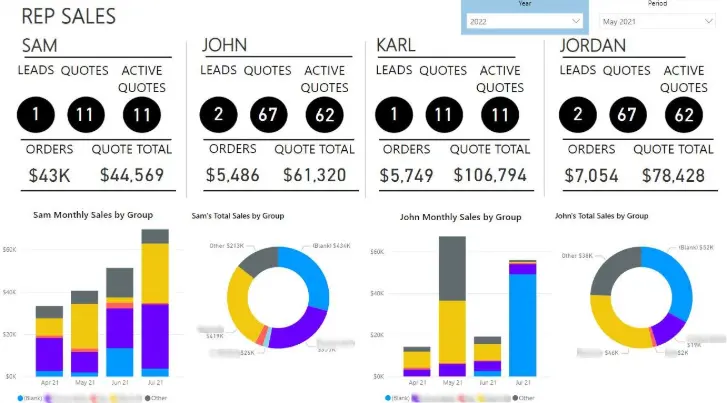
An example of a summary of sales using hard coded staff members (this is not dynamic). The client wanted to view the statistics of a select few staff, and it being dynamic was not important, so we were able to create these more personalised views around specifically only four members.
Simple Display
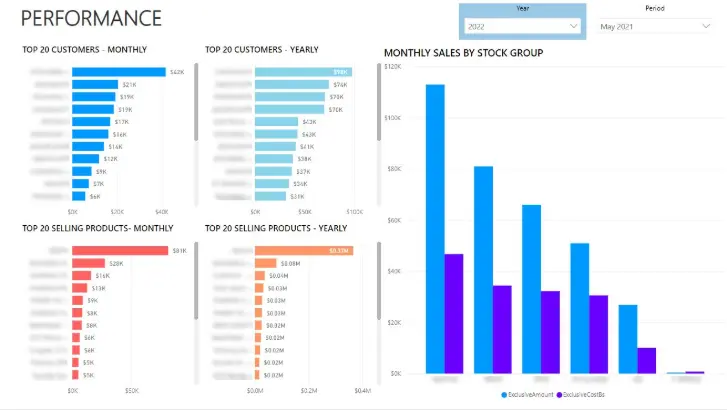
Bar Graphs showing top selling items or top buying customers
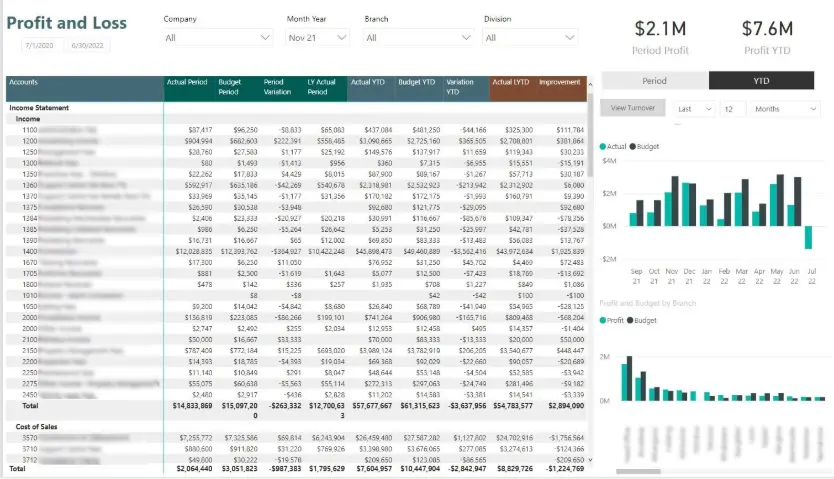
Detailed Tables
A detailed table display of profit and loss and variations based on different accounts. This also displays the ability to show data from the previous year of what the user had selected for comparisons
Reports
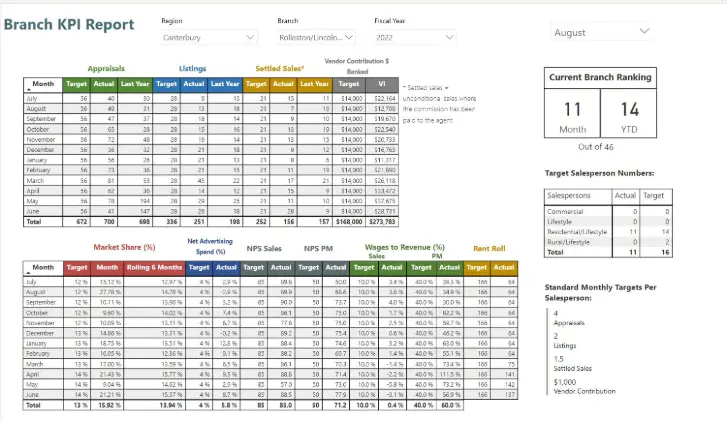
This report displays a customized set of tables, except data is pulled in from a variety of excel sheets dated for different months and years. A calculation for 'scoring' was also created in order to create rankings for different groups based on the data.